Using policy simulation games to better prepare epidemic-response strategies
ADELF EPITER 2026
NotePoster presentation
ADELF EPITER 2026 - Poster P2.28 - 23 July 2026, 14:00 to 14:30
1 Introduction
Emerging infectious disease outbreaks require combinations of public-health countermeasures. However, these measures differ not only in their expected epidemiological impact, but also in their acceptability to the population.
This study uses a Participatory Value Evaluation experiment to examine how individuals compose portfolios of countermeasures against different epidemic threats.
Rather than asking respondents to evaluate measures separately, the experiment places them in a simulated policy decision. Respondents must combine several pharmaceutical and non-pharmaceutical interventions while satisfying an epidemiological objective.
TipObjectives
The study has two main objectives: (1) To test Participatory Value Evaluation as a method for eliciting public preferences through a simulated policy decision task and (2) To examine how individuals compose portfolios of countermeasures against different epidemic threats, once the expected epidemiological effects of those countermeasures are taken into account.
2 Method
2.1 Expert-based design
Countermeasures and epidemic scenarios were first identified using a RAND/UCLA Appropriateness Method.
Experts identified four broad families of infectious diseases at risk of emergence:
- viral respiratory diseases
- vector-borne diseases and other zoonoses
- food- and water-borne diseases
- sexually transmitted infection
Experts also rated the appropriateness of potential countermeasures for each scenario on a scale from 1 to 9. This preliminary expert assessment informed both the list of countermeasures presented to respondents and their expected effects on hospital occupancy.
2.2 Portfolio-choice experiment
We designed a set of preference-elicitation tasks in which respondents composed portfolios of public-health countermeasures.
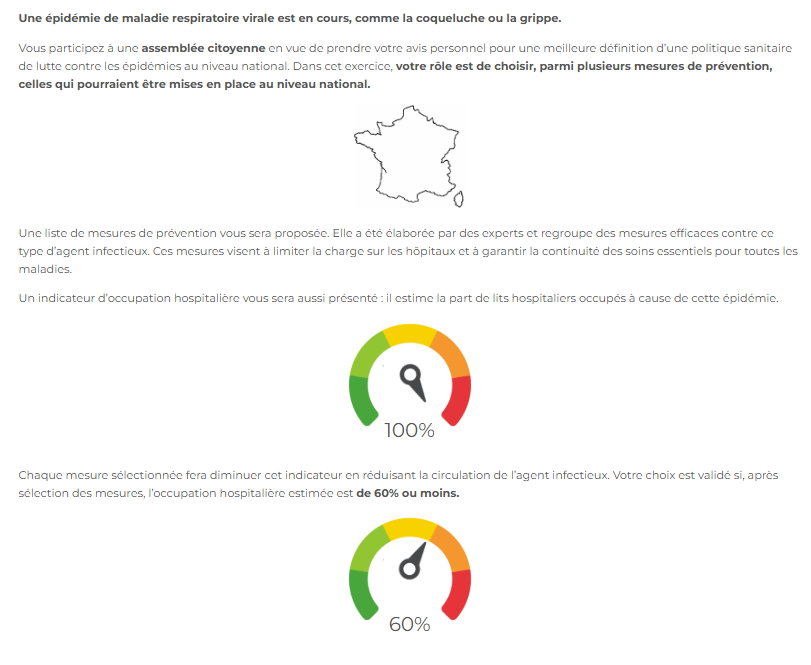
Hospital occupancy was initially projected at 100% in the benchmark task. Selecting countermeasures reduced projected hospital occupancy according to their expected epidemiological effects.
Respondents were required to reduce projected hospital occupancy to 60% or below before validating their portfolio.
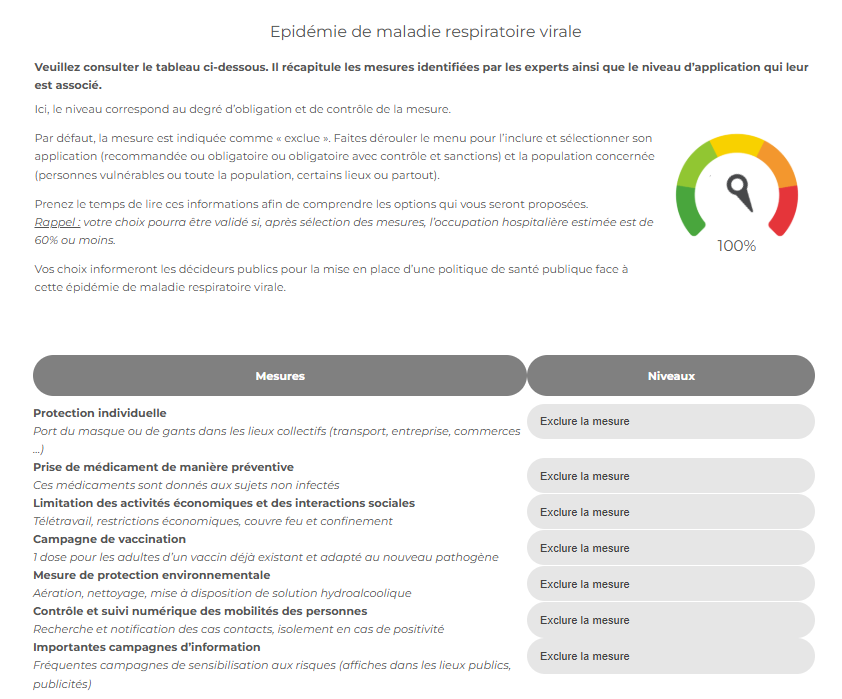
Depending on the experimental condition, respondents could either:
- choose whether to include or exclude each countermeasure; or
- choose both whether to include it and its level of implementation.
Implementation levels ranged from recommendations targeted at vulnerable groups to mandatory measures with enforcement mechanisms.
The experiment was conducted with a sample representative of the French population, comprising 4,166 respondents.
3 Experimental randomisation
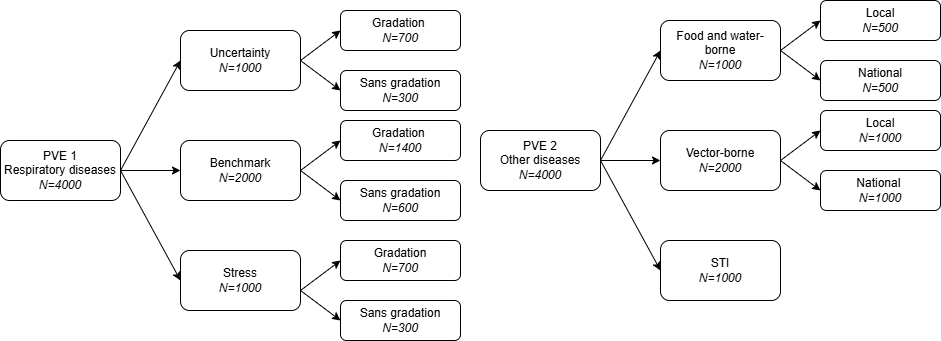
The experiment included several layers of randomisation:
 }
}
3.1 Epidemic scenario
Each respondent completed two policy-simulation tasks. The first task always concerned an emerging viral respiratory disease. For the second task, respondents were randomly assigned to one of three additional epidemic scenarios:
- vector-borne disease: 50%;
- food- and water-borne disease: 25%;
- sexually transmitted infection: 25%.
3.2 Graded and non-graded choices
In the respiratory-disease task, respondents were randomly assigned to one of two versions:
- graded version: respondents selected both the countermeasure and its implementation level
- non-graded version: respondents only decided whether each countermeasure should be included
Approximately 70% of respondents completed the graded respiratory task and 30% completed the non-graded version. The second epidemic task was always graded.
3.3 Benchmark, stress, and uncertainty framings
The respiratory task also included three experimental framings.
Benchmark: In the benchmark condition, projected hospital occupancy started at 100%, with no additional framing.
Stress framing: In the stress framing, respondents were informed about the consequences of severe pressure on the healthcare system, including overcrowded emergency departments, the cancellation of scheduled procedures, and increased pressure on healthcare professionals. Projected hospital occupancy started at 140% rather than 100%.
Uncertainty framing: In the uncertainty condition, respondents first completed the benchmark task. They were then informed that the epidemiological effects of their selected portfolio were uncertain. Hospital occupancy was presented using an uncertainty interval of \([\widehat{H}-12.5,\ \widehat{H}+12.5]\). Respondents could then retain or revise their initial portfolio.
3.4 Local and national implementation
For the vector-borne and food- and water-borne disease tasks, respondents were also randomly assigned to an implementation context.The selected countermeasures were described as being implemented either:locally, by local public authorities, or nationally, by the national government.
3.5 Randomisation of epidemiological effects
To distinguish preferences for the countermeasures themselves from preferences for their expected effectiveness, the marginal effect of each countermeasure was experimentally varied. For each countermeasure, respondents were assigned one of three possible effect levels:
- a low effect, equal to 80% of the central expert-based estimate
- the central expert-based estimat
- a high effect, equal to 120% of the central estimate
A reduced experimental design was constructed to minimise correlations between the effects assigned to different countermeasures while maintaining an approximately balanced distribution of low, central, and high effects. Each respondent was randomly assigned to one row of this experimental design per PVE task.
4 Econometric framework
4.1 Portfolios as choice alternatives
The unit of analysis is the complete portfolio, rather than each countermeasure considered independently. Let \(c\) denote a feasible portfolio and let \(\mathcal{C}_h\) denote the set of portfolios satisfying the hospital-occupancy constraint:
\[ \mathcal{C}_h = \left\{ c:H_c\leq 60 \right\}, \]
where \(H_c\) is the projected hospital occupancy associated with portfolio \(c\). We assume that respondent \(i\) selects the feasible portfolio that provides the highest utility.
4.2 Distance below the threshold
Individuals may differ in their willingness to reduce hospital occupancy further than required.We therefore define the distance below the validation threshold as:
\[ s_c = 60-H_c. \]
A value of \(s_c=0\) indicates that the portfolio reaches the required threshold exactly. Larger values indicate that the portfolio reduces hospital occupancy further below the threshold. Because the marginal utility of additional reductions may be nonlinear, the main specification includes both a linear and a quadratic term for this distance.
4.3 Utility specification
For the non-graded task, the utility that respondent \(i\) derives from portfolio \(c\) is written as:
\[ U_{ic} = V_{ic}+\varepsilon_{ic} = \sum_{j=1}^{J}\beta_j x_{cj} + \gamma_1s_c + \gamma_2s_c^2 + \varepsilon_{ic}, \]
where:
- \(x_{cj}=1\) when countermeasure \(j\) is included in portfolio \(c\)
- \(\beta_j\) captures the contribution of countermeasure \(j\) to portfolio utility
- \(s_c\) measures the distance below the hospital-occupancy threshold
For graded tasks, the model includes separate indicators for each implementation level:
\[ U_{ic} = \sum_{j=1}^{J} \sum_{l=1}^{L_j} \beta_{jl}x_{cjl} + \gamma_1s_c + \gamma_2s_c^2 + \varepsilon_{ic}, \]
using “countermeasure not included” as the reference category.
4.4 Choice probabilities
Assuming that the error terms follow an independent type-I extreme-value distribution, the probability that respondent \(i\) selects portfolio \(c\) takes the multinomial-logit form:
\[ P(c_i=c) = \frac{\exp(V_{ic})} {\displaystyle\sum_{c'\in\mathcal{C}_h}\exp(V_{ic'})}. \]
The models are estimated separately for each epidemic scenario and experimental version.
4.5 Interpretation
The coefficients should be interpreted as conditional preferences.
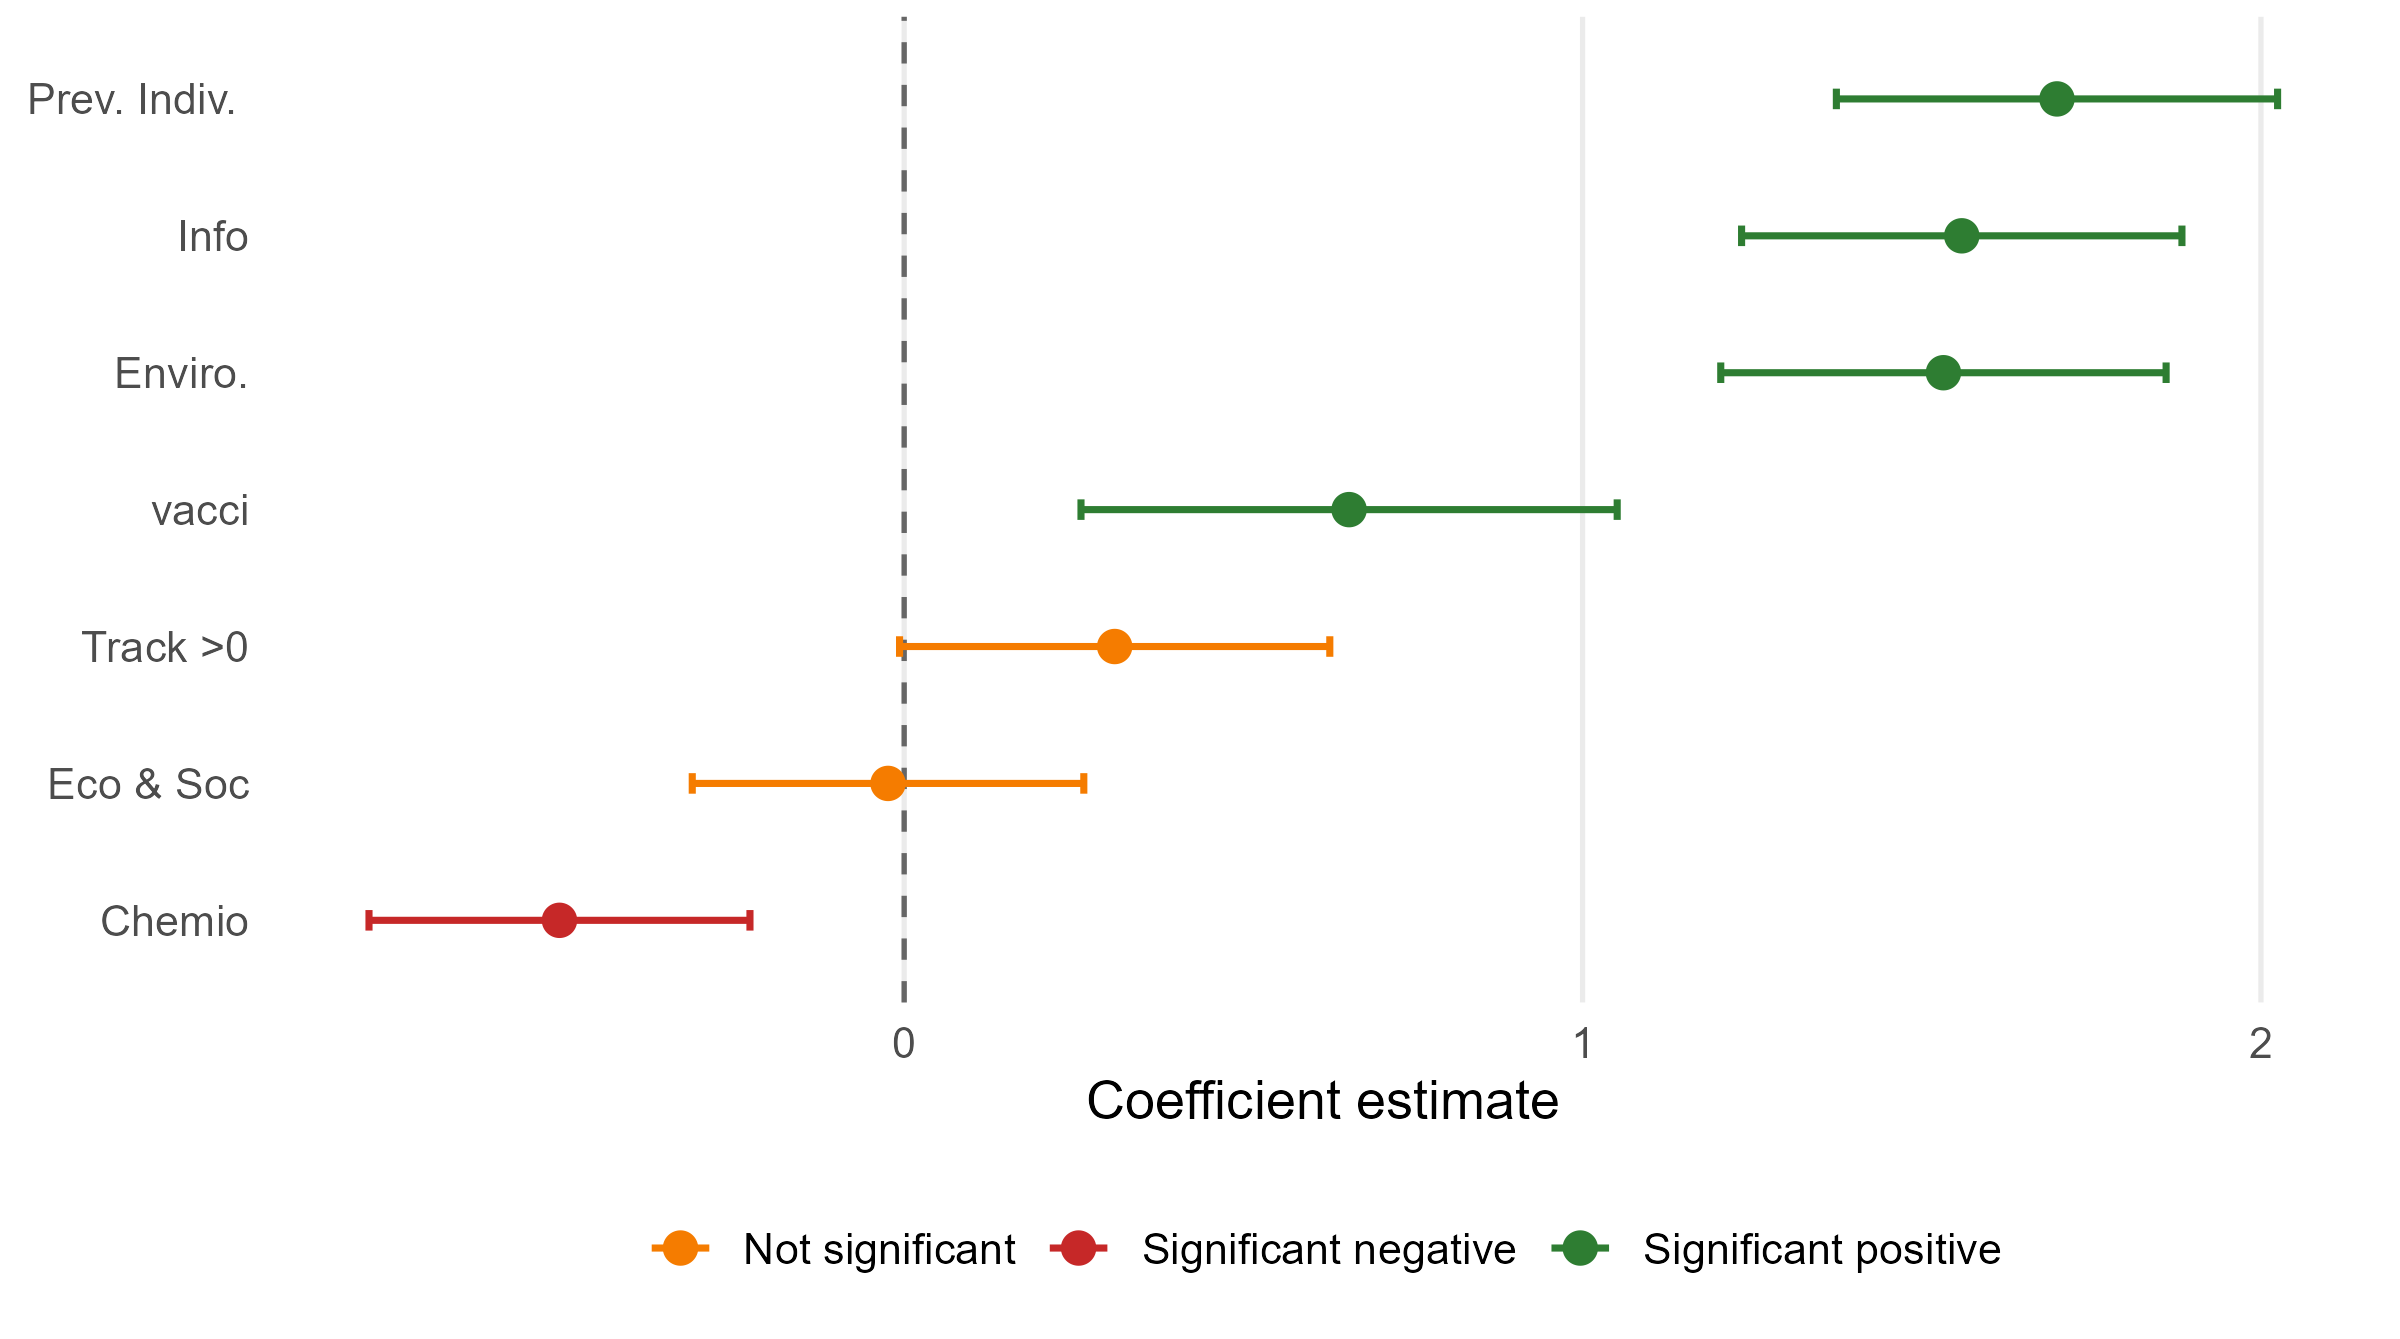
\(\beta_j >0\): A positive coefficient indicates that including the countermeasure or implementation level increases the utility of the portfolio, after accounting for its effect on projected hospital occupancy.
\(\beta_j <0\):A negative coefficient indicates that the countermeasure decreases portfolio utility relative to the reference category.
The estimates therefore capture preferences for the nature and implementation of a countermeasure.
5 Results
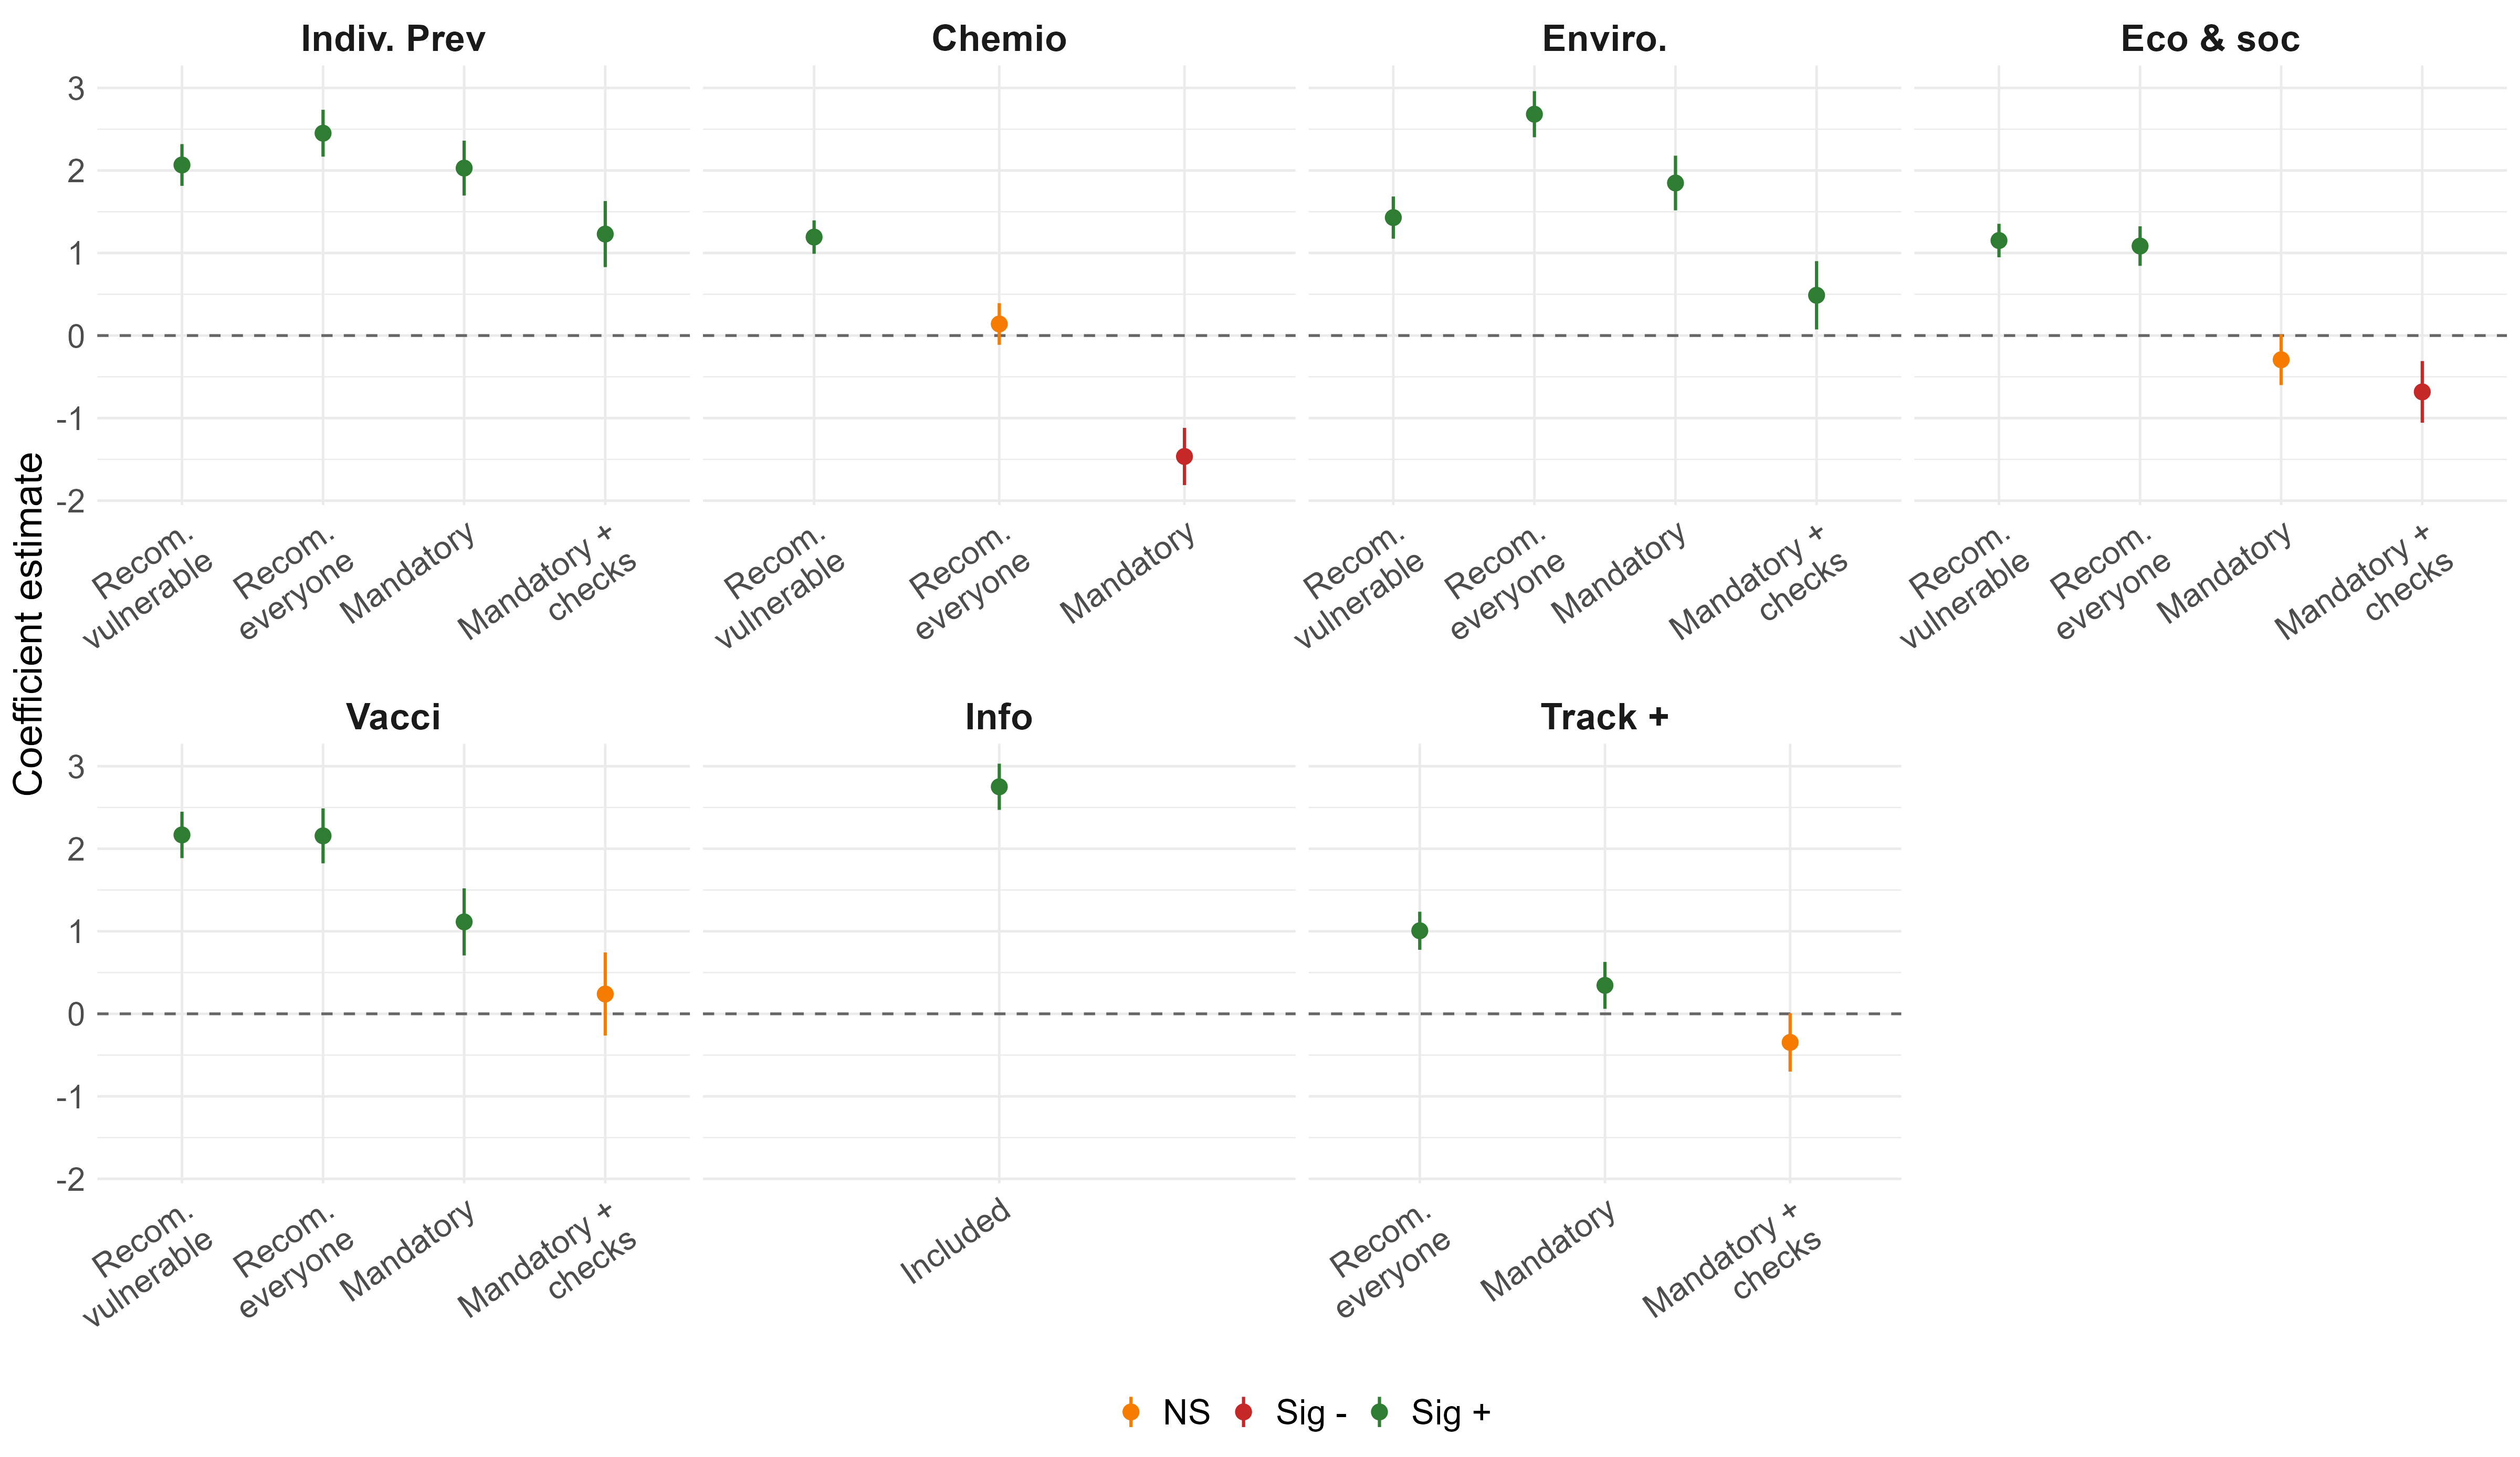
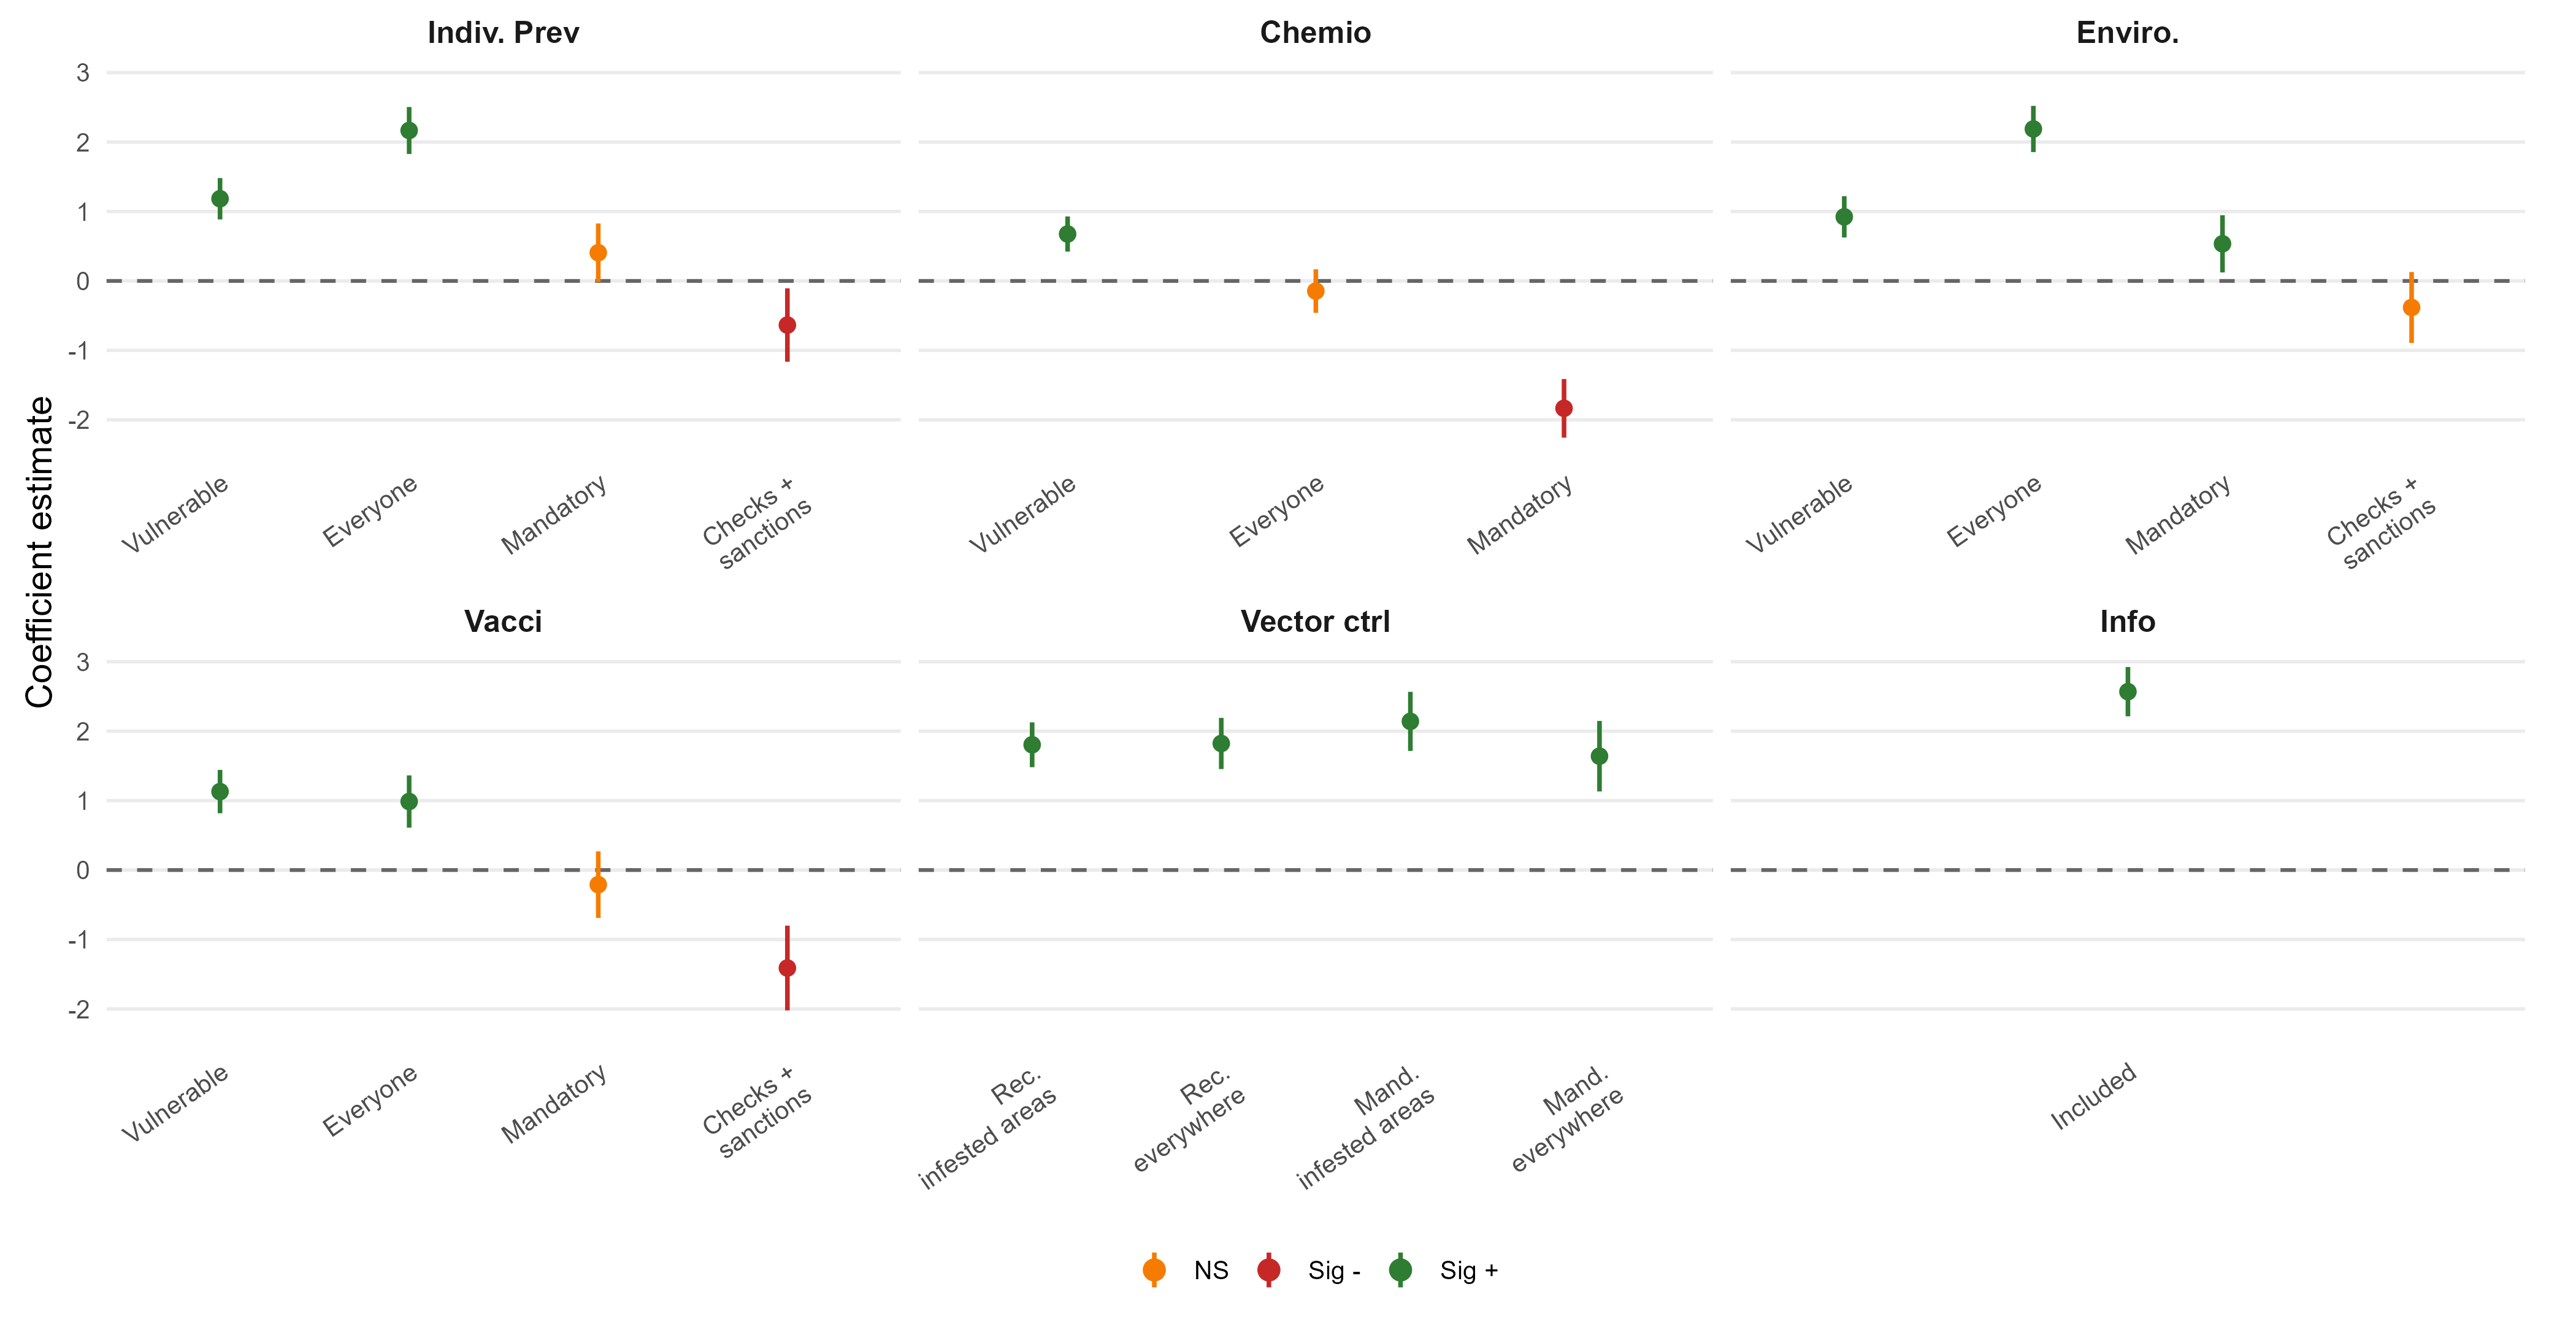
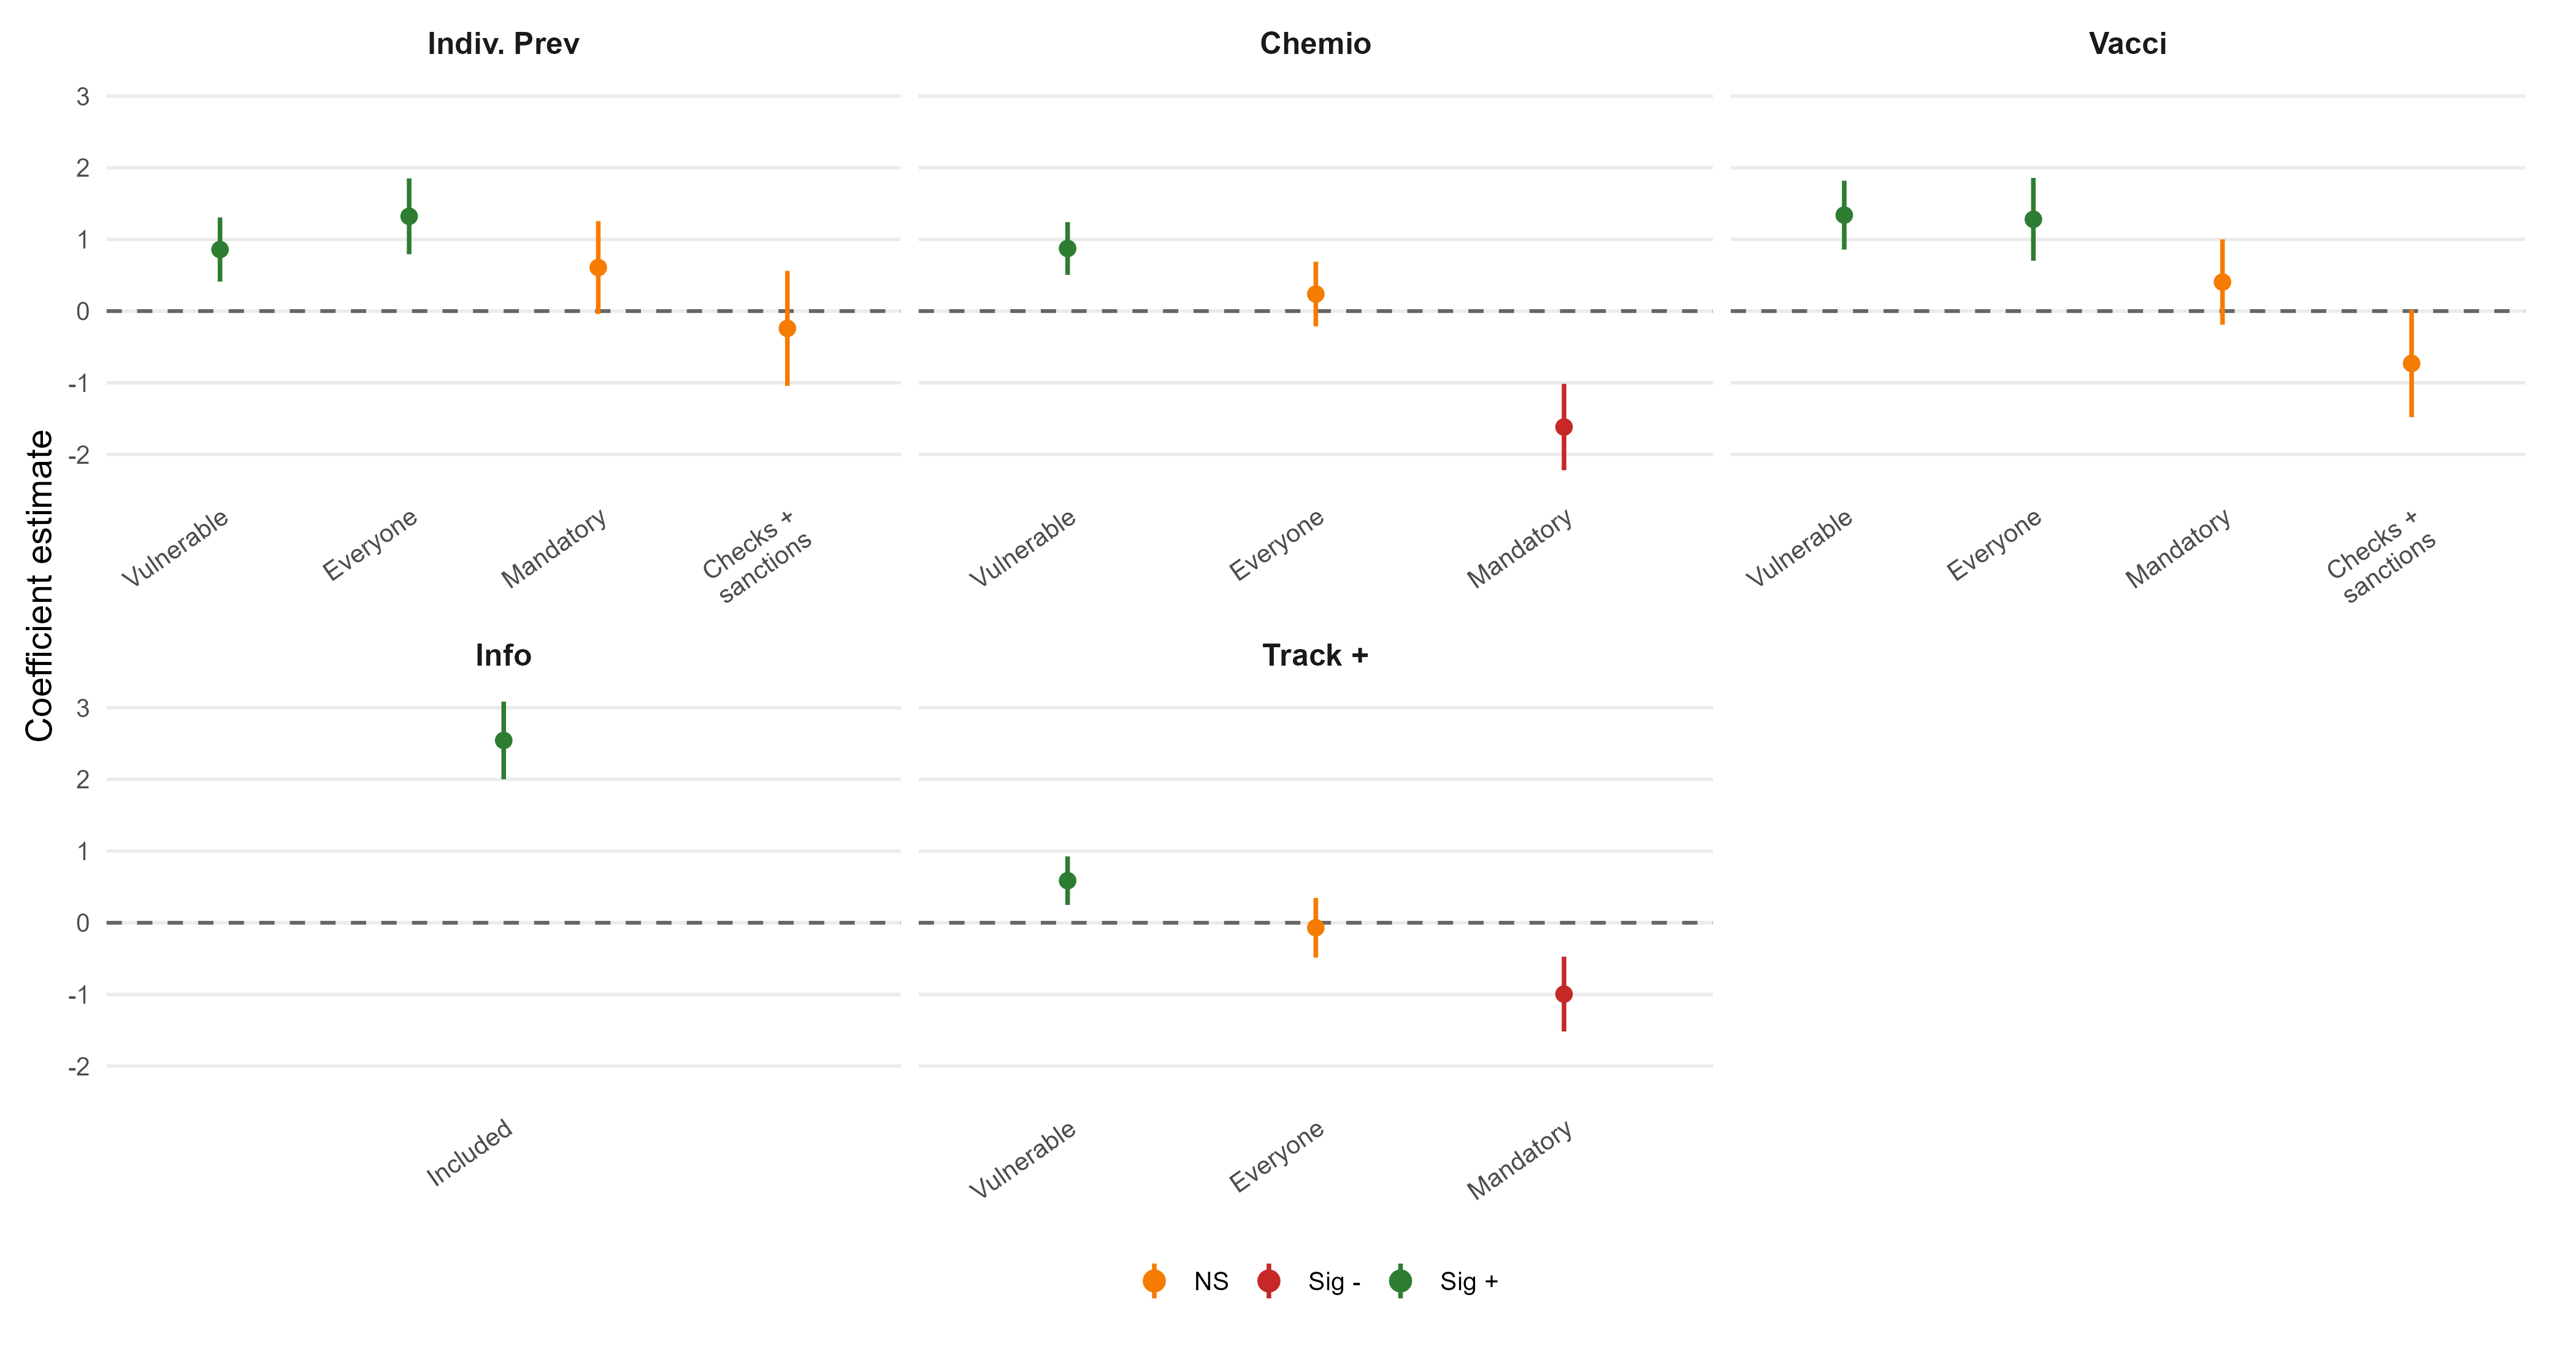
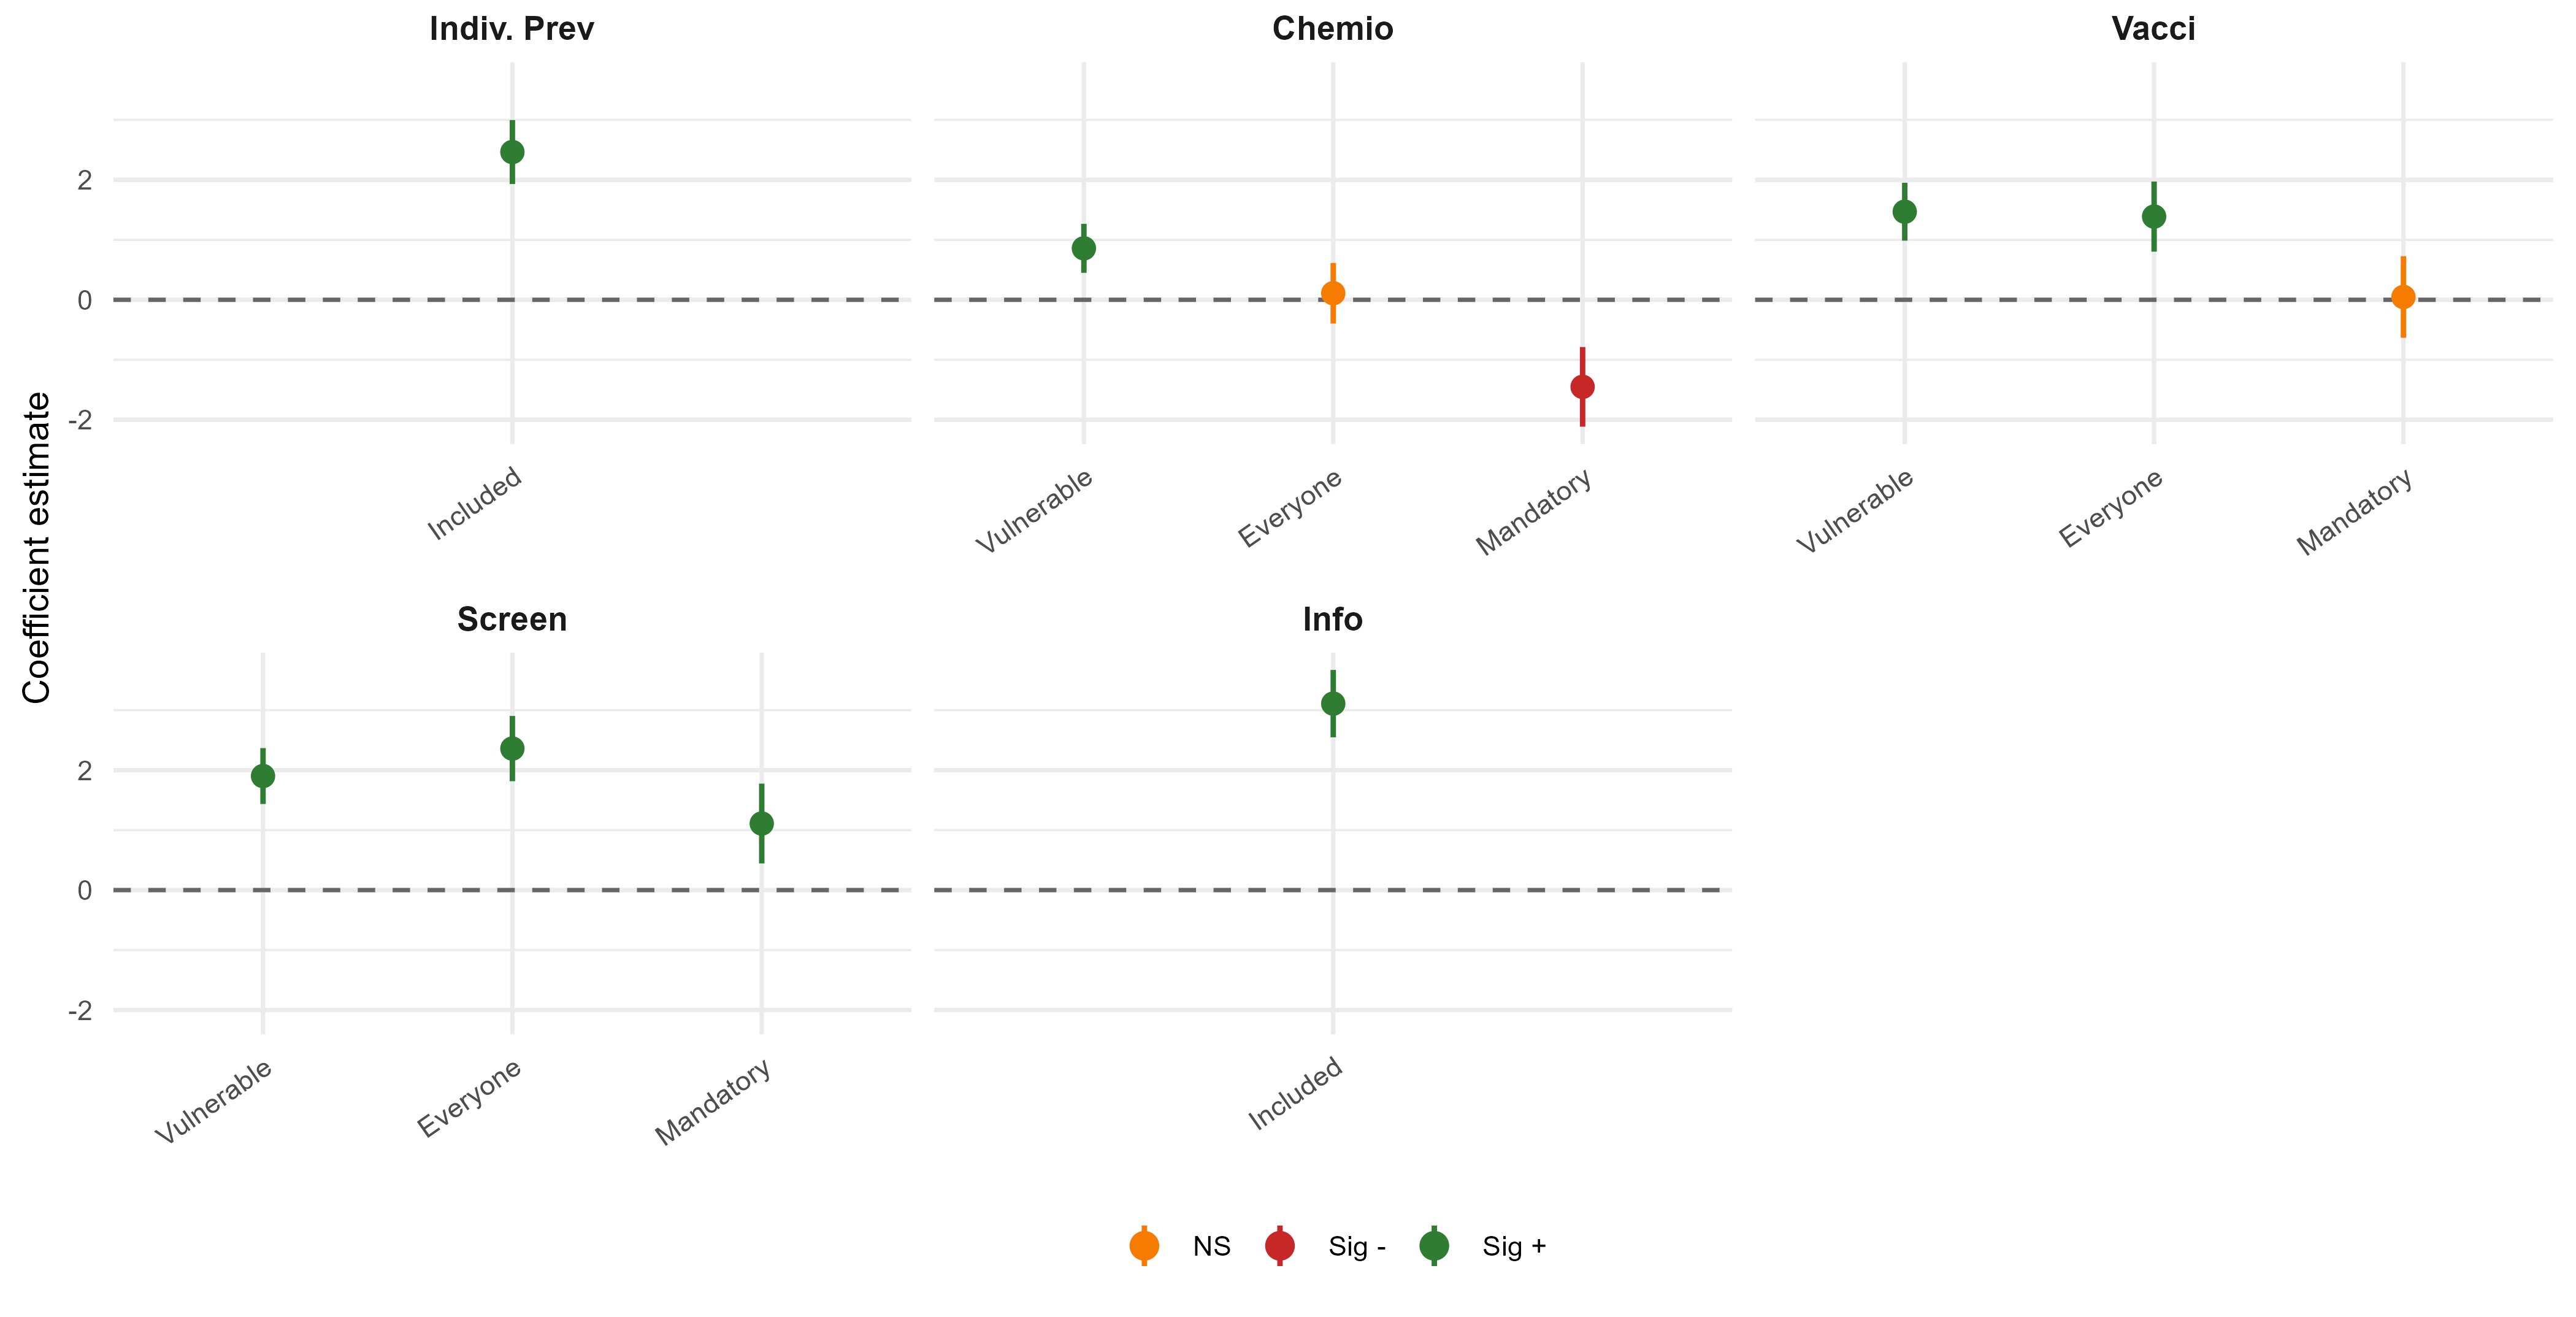
NoteReading the figures
Points represent estimated portfolio-choice coefficients and bars represent 95% confidence intervals. The reference category is countermeasure not selected.
5.1 Respiratory diseases
5.1.1 Non-graded task
5.1.2 Graded task
5.2 Vector-borne disease
5.3 Food and water-borne diseases
5.4 STI
6 Main takeaway
Public acceptability depends on the composition of the epidemic-response package, not only on its expected epidemiological impact. Preparedness strategies should therefore combine epidemiological expertise with evidence on public preferences to design epidemic-response packages that are both effective and acceptable in practice.
7 Conference poster
The poster presented at ADELF–EPITER 2026 can be viewed below.
8 Information
8.2 Contact
Antoine Lacombe - Postdoctoral researcher - Aix-Marseille School of Economics (AMU) - antoine.lacombe@univ-amu.fr